

Today’s post is by contributing writer Robert Diehl. Bob was born and raised in New York City. In college he published a literary magazine and produced performance art in the slowly re-filling area that came to be known as SoHo. His first 16 careerist years were spent in global finance and travel related services until he moved to Dallas with JCPenney. Warding off terminal boredom, a ‘when in Rome’ epiphany led to owning and breeding horses which brought him to the Valley of the Sun in 1990. He moved to a small horse ranch nestled in a desert landscape along the far edges, which kept moving farther out. It was a wonderful interlude, which ended in 1999 when he moved to downtown Phoenix, opened an art gallery, married his wife, Flannery and helped raise her daughter. Empty nesting brought a new set of ‘what do I want to be when I grow up’ questions, and this occasional series is one of the attempts at answering them, along with creating a TEDx series on urban resilience, joining Hance Park Conservancy, Friends of the Hance Park Dog Park, Roosevelt Action Association, Arltlink, CONDER/dance, helping save mature street trees from pedestrian enhancement bulldozers and otherwise pestering municipal leaders with irritating questions.
Below are Bob’s remarks at a City of Phoenix Budget Hearing on April 16, 2013 to convince the city to allocate funds for improved bicycle infrastructure:
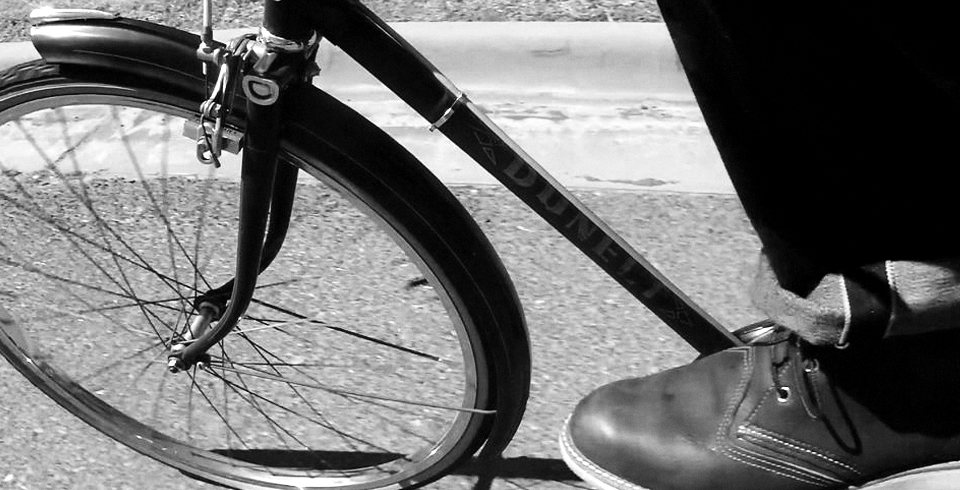
I want to spend the rest of my life in Phoenix – but a Phoenix that has dense urban neighborhoods. If this doesn’t happen soon I’ll have to leave Phoenix while I can still ride my bike. We went car-free this year in order to keep the pressure on ourselves to help you do the right thing by our City’s future. Or, to move away of course …
You’ve earned this consideration because:
1. You’re wonderful at restraining expenditures, and over this recession have kept top credit ratings with S&P and Mopodys.
2. You have abundantly realized the American municipal ‘manifest destiny’ of the post WWII era, moving us from 99th to 6th place in city population by
– increasing our population 23-fold [2.1]
– our land 54-fold and [2.2]
– our cars 76-fold [2.3]
– creating the 2nd highest detached home ownership rate among the top 10 cities
– almost tripling our sprawl (from a 6.8k/sm density in 1940 to 2.8k/sm today) [2.2]
We beat out just about every city in almost all of these categories the past 60+ years, except that:
– our per capita income is almost in last place among our peers – the top 10 cities in America [2.5]
– and we have not budged since 1940 in our per capita income – its still, stubbornly, at only 85% of the nation’s. [2.4]
We have not become relatively more wealthy for all this exponential growth. But we do have 1,215,000 [2.3] personal vehicles which roam freely over our 6-10,000 miles of City streets [2.6].
$72 Million a year [2.7] go just to maintain all that roadway. Luckily, most new roads are paid for by developers of new subdivisions [2.8],
– and two thirds of the street and intersection widening is paid for by assessments to local businesses, and local injections of State and Federal tax revenue
– only 10% of the $565 Million in new build, rebuild and widenings over this 5 year cycle comes from City bonds [2.9]
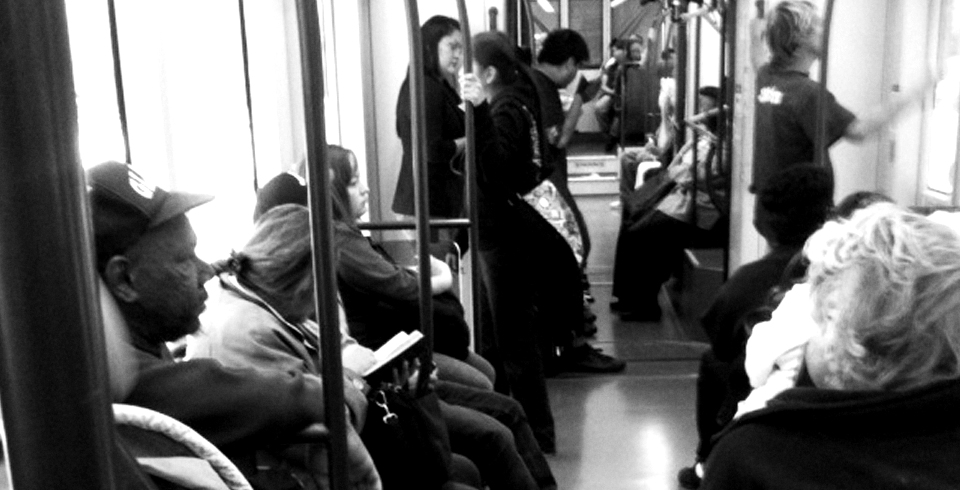
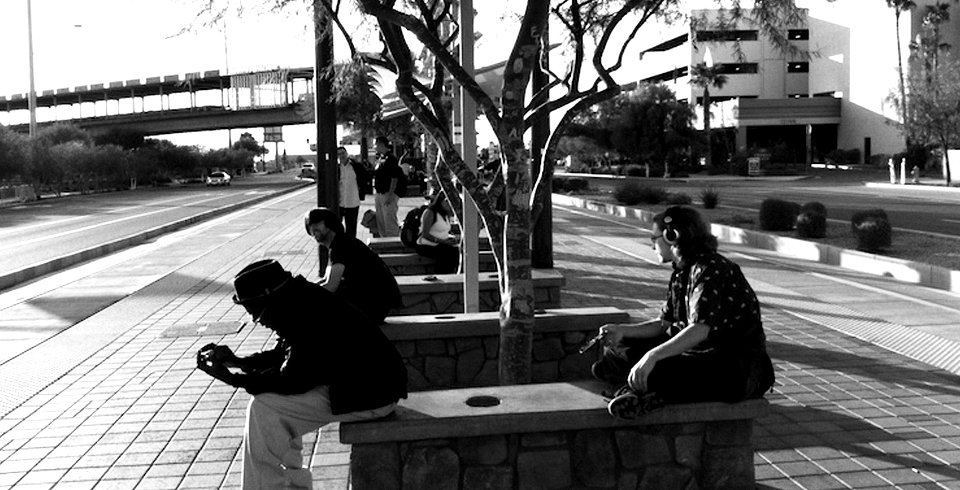
Around 150,000 people daily use mass transit at over 4,000 bus or light rail stops to get to work and school, and as many as 3,600 take their bikes with them [2.10] . Why? Maybe it’s
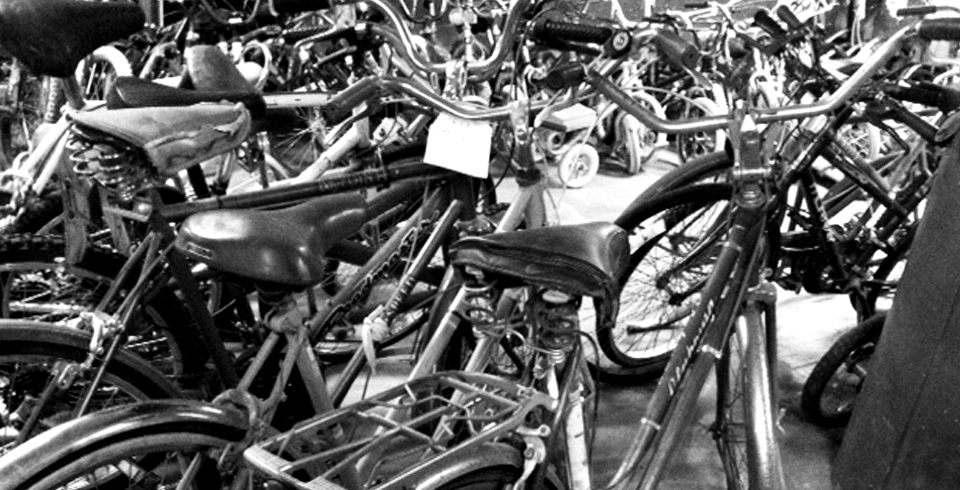
– because only 112 bikes in total are able be stored [2.11]
– at only one out of every 308 transit stops [2.11]
– while over 6,500 cars can be parked at 17 major transit stations [2.12]
Who needs this more, drivers or bicyclists? But I digress.
What does all this have to do with increasing the bike lane budget?
My time’s up. I’ll be at Thursday’s Library meeting [Bob’s remarks from this hearing are below] and need to finish that script before then. In the meantime, remember: building bikelanes builds wealth!
This is the presentation Bob made on April 18, 2013 at the second City of Phoenix budget hearing:
Full disclosure – I produced a yearlong series of nine TEDx events on Urban Resilience and was asked to give a TEDx talk this year on Urban Dsiruption in conjunction with the globally simulcast Gates Foundation’s TEDx. I became increasingly concerned, while writing that talk, that I should deliver it to our City’s stewards before they hear it from another stage. This 3-parter is a slice of that.
So, about our 500+ miles of bike lanes – that’s an impressive 5% of our total street mileage, about 1 out of every 20 feet of street. I haven’t been able to find it though – where are all these miles? How much did it cost to create them? What impact have they had on City life? I can’t find much on those topics.
So I turned to a City that seems to have documented these things well – New York – which has created 250 miles of bike lanes for $21,000 a mile in the past 6 years – and got the Federal Government to give it $6.4 million to do so. Where is our version of that $6.4 Million?
NYC has learned a lot from this $8 million effort including the fact that, on average on streets with protected bike lanes, traffic accidents fall by 40%. Every single kind of traffic accident. In Phoenix that could mean $500 Million a year in recovered economic activity, dozens of lives saved and hundreds of injuries prevented.
Here are some per capita fun facts:
– The average New York household takes 1,092 transit rides a year. The average Phoenix household takes 86 transit rides a year. – 3.3 billion rides vs 53 million rides, or $2,730 vs $173.
– 50,000 regular adult size bikes and 25,000 small wheel bikes are bought each year. Maybe 6,200 people bike to work. Who knows how many bike to school? It seems 4,500 of them take that bike on mass transit.- $6.4Million since 2006.
– It takes 1.7 households to own a car in New York, and only 3/4 of a household to own a car in Phoenix.
This is a break down of Phoenix population dynamics:
Where we excel:
– Valleywide we own 2.2 Million cars to get to 1.8 Million jobs. Why?
– We have 1.5 times the national rate of uninsured households [22.7% vs 15.1%] That’s a lot of medical expense the taxpayers pay for. Why? Because maybe, beside working for Walmart, partly we’re more terrified of not having a car than not having health coverage, and a car costs $9,000 a year on average to own, drive and insure?
– We have 1.2 times the national rate of mortgage lienholds on title [84.1% vs 70.7%]
– We have 1.2 times the national rate of renter households [38% vs 32%]
– Over 1.3 times the national growth rate in 30-44’s [10.5% vs 7.8% – the cohort with the highest mortgaged home rate [92% of homeowners have mortgages], the highest mortgage debt to income ratio, and the largest number of financed vehicles. This has the effect of draining $3Billion out of their personal income and out of the local economy. That represents 83k houseolds, 14% of our households pouring $17,000 of their household income out of the local economy every year – the other half, only $7.600.
– Phoenix households spend $12,000 a year on transport, NY households $8,000
– Why do we spend $3,000 per household on gasoline?..
Where we are challenged:
– We have 92% the median home value nationally, and beat the national bell curve only in the $80-175,000 range. Why?
– We did not grow our 20 somethings in the intercensal period, during which they robustly grew nationally and in the rest of the county [0.7% vs 11.3% and 13.4%]
– The rest of the county outgrew us in accumulating boomers – 1.65 times as fast [68% vs 41%]
– The rest of the county had triple the growth of retireds 38% vs 13%
– Phoenix households pump $9,000 out of our economy, NYC hhlds $4,000
– Phoenix loses $5,000 for every household relative to a high transit city like New York – where the wealth is lost forever. That’s another $2.6Billion lost, on top of the $3Billion lost by our Baby Buster households alone.
So $6 billion in just a few categories – car ownership, traffic accidents and the mortgage interest paid by baby busters, sucked out of gross personal income of only $29 Billion.
We have lost a few demographic rounds in the fight to make our future good. Let’s setup to win a few – stop quibbling over whether to add or subtract 5/100’s of a percent of streets budget to bike lanes – let’s stop the next 10 miles of streebuilding and throw those millions in bicycle infrastructure. Why? Think about it. Please.
References:
2.1 Population:
– 1940 Census “Phoenix City” = 65,414
– 2010 Census “Phoenis (city)” = 1,469,471
– 22 ½ times greater, or 23-fold
2.2 Land/Population Density:
– 1940 = 9.6 square miles, 6,814 people per square mile, source Jon Talton http://www.roguecolumnist.com/
– 2010 Census = 516.70 square miles, 2,844 people per square mile
– 53 ⅘ times greater, or 54-fold
2.3 Cars:
– 1940 = 16,068 Phoenix taken at 100% of U.S. rate source: U.S. Dept of Energy “Fact #617: Changes in Vehicles per Capita Around the World” web link http://www1.eere.energy.gov/
– 2010 = 1,214,545 source: CLRsearch website “Phoenix number of vehicles per household” http://www.clrsearch.com/
– 75 ⅔ times greater, or 76-fold
– per capita car ownership is 95% of United States average, 2.1 vs 2.2
2.4 Per Capita Income historical
– 1940 = 84.9%. US per capita = $595, Phoenix per capita = $505 [taken as 100% of the Arizona per capita] source US Census Bureau “No. HS-35. Personal Income and Personal Income Per Capita by State 1929-2001” web link http://www.census.gov/statab/
– 2010 85.5%. US per capita = $41,404, Phoenix per capita = $35,422 source US Dept of Commerce Bureau of Economic Analysis “Local Area Personal Income 2009-2011” web link http://www.bea.gov/
2.5 Per Capita Income comparative 2010
-2010 Top 10 Cities comparison source United States Census Bureau “State and County Quick Facts” web link http://quickfacts.census.gov/
CITY PER CAPITA POPULATION
INCOME RANK
San Jose $33,770 10
San Diego $33,135 8
New York $31,417 1
Los Angeles $28,222 2
Chicago $27,940 3
Philadelphia $27,824 5
Dallas $27,251 9
Houston $26,849 4
Phoenix $24,365 6
San Antonio $22,333 7
2.6 Local roadway miles.
City of Phoenix lists having
4,845 miles of roadway http://phoenix.gov/webcms/
914 miles of alleys http://phoenix.gov/webcms/
5,759 miles of roadway, or 11 miles of roadway for every square mile
Every square mile I ‘dipstick’ on google maps yields between 14 and 20 miles of roadway
2.7 Streets maintenance budget
$72,762,000 City of Phoenix Summary Budget 2012-13 page 130 web link http://phoenix.gov/webcms/
2.8 New streets in subdivisions built at developer expense
City of Phoenix Code Section 32-33 covering related ordinances pased since 1999 web link http://www.codepublishing.com/
2.9 Street building budget
$565 Million 5-year budget of which
$359 Million is clearly sourced to State and Federal tax transfers [63.5%],
$ 15 Million is clearley sourced to impact fees and
$ 57 Million is clearly sourced to City Bond proceeds [10%]
source City of Phoenix Street transportation and Drainage Fiscal Years 2013-17 page 171 web link http://phoenix.gov/webcms/
2.10 Valley Metro Ridership
154,294 Weekday ridership inside Phoenix of all Valley Metro lines
3,594 Weekday bicycle boardings inside Phoenix of all Valley Metro lines
souce Valley Metro FY 2011-2012 Ridership Report web link
http://www.valleymetro.org/
Page numbers cannot be cited. There are two lines in the report summing up ridership at locations inside Phoenix borders as follows
LINE RIDERSHIP BIKE BOARDINGS
Local bus 30,352,926 721,418 or 2.4% of ridership
Express bus 1,660,986 19,950
Light rail 6,559,514 0 , I derived an estimate of 2.4% and added
157.428
TOTALS [T[ 38,573,426 898,596
DAILY [T/250] 154,294 3,594
2.11 Valley Metro Bike stands and lockers
20 bike capacity total of bike stands at 4 of the 20 light rail stops
0 bike lockers at light rail stops
40 bike capacity total of bike stands at 7 bus transit centers
51 bike capacity total of bike lockers at 10 bus transit centers
0 bike stands as 3,900 bus stops
0 bike lockers at 3,900 bus stops
60 bike capacity total of bike stands at 11 locations citywide
51 bike capacity total of bike lockers at 10 locations citywide
source Bicycle Locker Storage at Regional Park-and-Rides updated September, 2011 web link http://www.valleymetro.org/
2.12 Valley Metro parking lots
6,551 car capacity at 17 park-and-ride locations citywide
source Valley Metro Park-and-Ride Locations web link http://www.valleymetro.org/
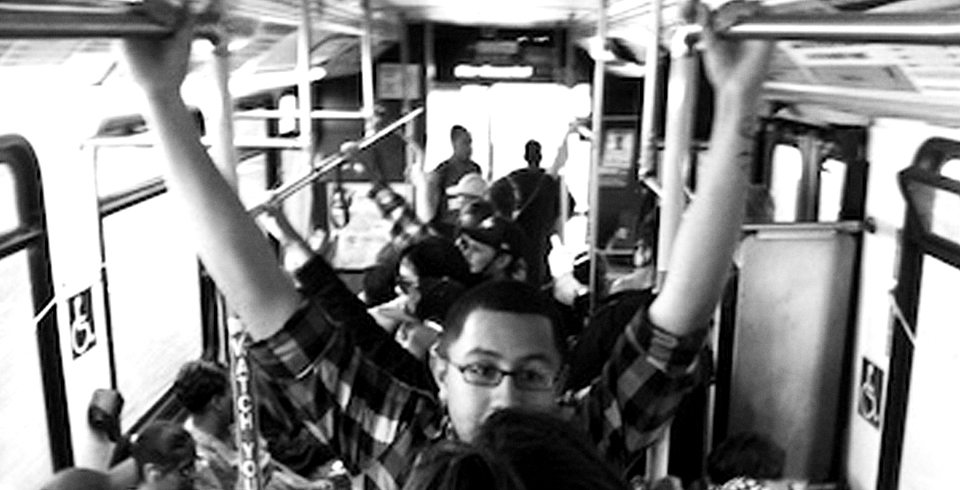
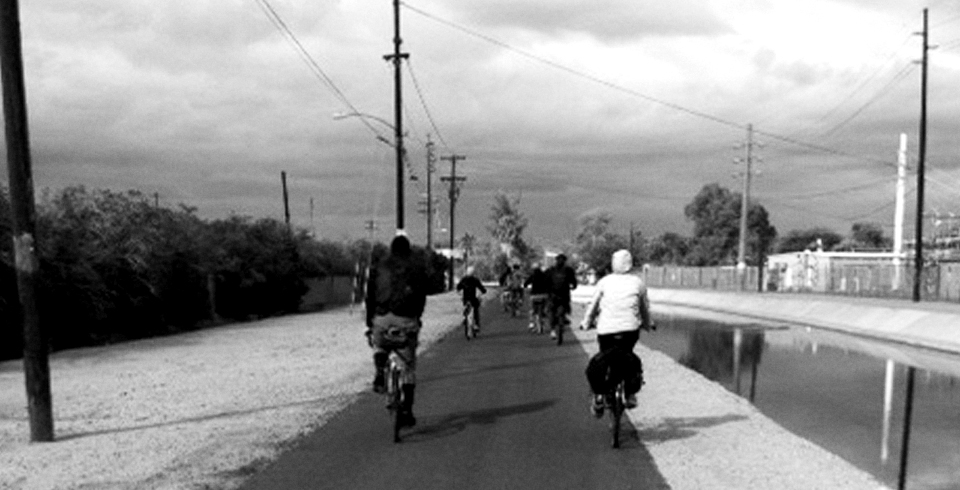
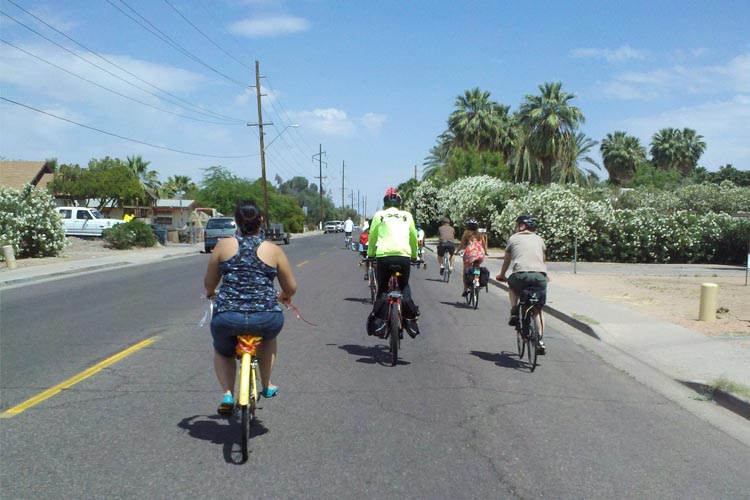
Photo Credit: Photo from Phoenix Spokes People.


[…] Diehl, a friendly neighbor of mine, contributed a post this week to Blooming Rock on why the City of Phoenix should invest in bicycle infrastructure. His post highlights the […]