

Today’s post if by contributing writer Beth Johannessen. Beth is a recent graduate of University of Arizona’s Masters of Landscape Architecture program. Currently, she is the landscape designer at Phun:Design Studio a sustainable design and development firm here in Phoenix. Her approach to design includes a focus on urban infill, placemaking and community based design that celebrates the native Sonoran Desert habitat.
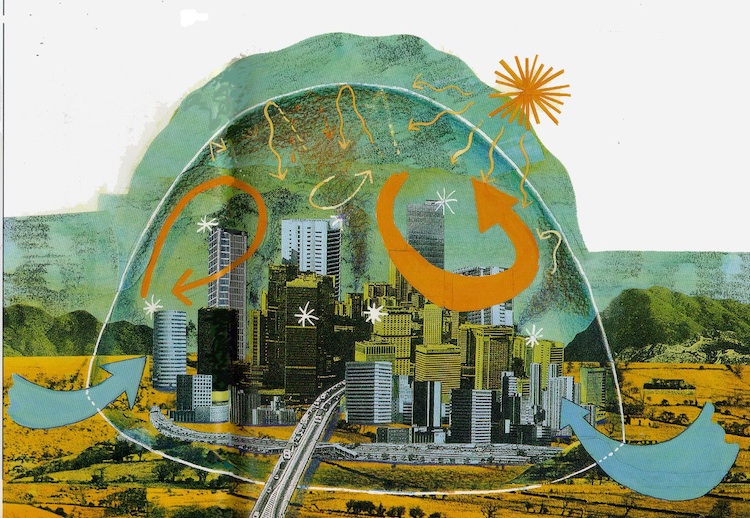
We can all exhale a collective sigh of relief; another hot summer is coming to a close here in Phoenix. With the end of summer comes the promise of spending some much needed time outdoors. However, now is a great time to discuss the Urban Heat Island (UHI) while the heat is still fresh in our memories. If you’re a frequent blooming rock reader than you know all about how much hotter Phoenix is becoming due to the Urban Heat Island. The UHI is the warming of nighttime temperatures caused by the increased absorption of solar radiant energy in urban regions and the subsequent release of the energy at night. There are three key contributors to UHI: landuse patterns, material use and lack of evapotranspiration. The principal reason for the nighttime warming relates to land use patterns: buildings block surface heat from radiating into the relatively cool night sky. In addition, manmade materials such as asphalt and roofing tiles tend to absorb more solar energy and release it more slowly than natural vegetation. The final cause of UHI is the lack of evapotranspiration (for example through lack of vegetation) in urban areas. All of these factors combined result in summer nighttime temperatures 11°F higher than they were just 30 years ago.
What you might not know is the elevated temperatures that are created by UHI have significant impacts on the health and well-being of our city. The EPA determined that UHI impacts include: increased energy consumption, elevated levels of air pollutants and greenhouse gasses, compromised human health and comfort, impaired water quality and increased water use. According to a study published in Journal of the American Planning Association in 2009 for the month of June in Phoenix, “a 1° F increase in temperature resulted in a 290 gallon increase in water use per single-family house” which amounts to roughly 94 million additional gallons of water used in that month.
A primary strategy to mitigate the Urban Heat Island, recommended by the United States Environmental Protection Agency, is to increase the urban forest canopy coverage. In 2010, the City of Phoenix adopted the 2030 Shade Tree Master Plan in order to address the reduction of the urban forest and consequently the impacts of the UHI. The plan lays out approaches to restore the urban forest and achieve an average of 25 percent canopy coverage for the City of Phoenix by 2030.
One way the City proposes to restore its urban forest is through a Connected Oasis of green streets that link to existing public green spaces or nodes. For all you u fans you’ll urbanism fans you’ll be happy to hear that The City of Phoenix used a layered placemaking approach to develop the Connected Oasis concept in downtown. Opportunities and constraints were identified and a broad stroke plan was established demonstrating how various existing and planned projects would work together to increase shade, improve connectivity and walkability as well as harness opportunities for placemaking in downtown Phoenix. Currently, the Connected Oasis is being implemented in piece meal fashion but is proving successful. However, the problem is massive in part because the City of Phoenix covers 519 square miles. The City of Phoenix itself maintains about .003% of 519 square miles as right of ways and the current existing average shade coverage (this includes City maintained parks) is roughly 8 percent. In addition, the only extant detailed plan focuses solely on downtown Phoenix which encompasses roughly 90 acres of land.
Even so, urban shade coverage is not just an issue of square footages and shade canopy percentages. Research shows that lower socioeconomic and ethnic minority groups are more likely to live in neighborhoods with greater exposure to heat stress. Dr. Sharon Harlan, a researcher at ASU’s Global Institute of Sustainability notes that residents in low income neighborhoods are more vulnerable to heat exposure because they have fewer social and material resources to cope with extreme heat. For example, many may not have access to air conditioners or cannot afford to pay for them. Vulnerable populations are more likely to live in hotter neighborhoods as well. Dr. Darren Ruddell another research at ASU discovered that for every $10,000 an area’s income rises, the average outside temperature drops one-half degree Fahrenheit. While people living in low income areas could be exposed to 21-24 hours of extreme heat, people in more affluent neighborhoods may only experience 9-12 hours a day of extreme heat. This disparity in part is caused sparse vegetation, and a lack of open space in poorer neighborhoods. The diagram below is from my 2012 master’s thesis demonstrating typical shade coverage in neighborhoods south of downtown Phoenix as it compares to middle class to upper middle class neighborhoods north of downtown Phoenix.

We need to do better for our fellow Phoenicians. Both researchers call for UHI reduction policies that specifically target vulnerable residential areas however, to date, no plan exists to address UHI in vulnerable residential areas like the neighborhoods just south of downtown Phoenix. This is why my next few posts will cover how to expand the Connect Oasis into South Central Phoenix, which is a topic I spent a year studying as part of my master’s thesis (insert groans here). Don’t worry there will be more pretty pictures next time. But seriously, by addressing the issues and advocating for changes in our most vulnerable neighborhoods, we all benefit from a cooler city, literally and figuratively.


Beth, I know that part of the Tree and Shade Master Plan is to have all of PHX have a 25% tree/shade canopy. How much exactly is 25%? I find that hard to visualize. Is that what Willo has? Encanto Palmcroft maybe? Or does E.P. have greater than 25%?
I wish they would’ve said something more along the lines of “all areas have shade equal to X neighborhood”, that way I think it would be easier to visualize.