


Today’s post is by architect/urban planner/thought leader Kevin Kellogg, who, I feel lucky to say, is a regular contributor on the Blooming Rock blog.
 While the history of Phoenix points to low density, suburban sprawl as the continued norm, it is possible to grow both economically and accommodate more population in a sustainable way by focusing the future growth onto vacant land around light rail stations.
Much as the 1985 highway plan has enabled sprawling subdivisions around freeway off-ramps, the light rail line presents a transformative investment that could shape new types of urban places for the Valley: a series of easily accessible, walkable, inclusive and sustainable neighborhoods. Former ASU planning department chair Nan Ellin called this concept the “Connected Oasis”, where short walks, bike rides and trains are the norm, connecting people’s homes to their destinations: work, shopping, schools, parks and activities. Ideally, shady sidewalks and bike paths lead to light rail stations and higher density development accommodates enough population density to support local businesses. Not only are you in your car less, you spend less time commuting in general, because most basic services are within walking distance from home. Homes of many types and price are mixed with open space, work places and shopping. The planning and real estate term for this type of urban design is Transit Oriented Development, or TOD.
I’ve generally concentrated on more thematic content in the column, but this piece is really about geometry and math. Don’t stop reading! It’s fuzzy math, meant to prove a point, rather than to split hairs on statistical methodology. Now, for a little number crunching. The cities of Phoenix, Mesa and Tempe are unique in the Valley for the fact that they all are served by Light Rail. The 3 cities are also unique in that they maintained a combined population growth rate of less than 1% per year from 2000-2010. Compared to growth rates of 30%-40% in outlying areas, these rates of growth would be considered sustainable. Almost all of the growth in the 3 cities, however, happened in their own outlying areas. Very little changed inside the 101 loop.
The 3 cities combine a vast area of almost 700 square miles of land, more than Chicago, Portland, Seattle, San Francisco, Boston, and Denver combined. Within the most central parts of the 3 cities, where there has been the least change in recent years, about 20% of the land is vacant, and about the same amount of built commercial space is vacant. That means that 1/5th of all productive land and buildings are not occupied. Yet, thousands of homes were built in areas of Maricopa and Pinal Counties, over an hour’s drive from job centers, which now stand vacant as well.
A couple of other statistics stand out as well: housing costs and transportation costs. If you combine the costs of both housing and transportation, the affordability of living in far flung corners of the metropolitan area begins to wane. The combined cost, known as the housing-transportation affordability index (HTA) is generally less than 45% of earnings in the central cities, but up to 60% outside the 101/202 loop. The increased cost reflects the long commutes to job centers from newer high-growth areas of town.
What does all this mean? Furthermore, who cares?
What this means is that it’s not really less expensive to live far from work. It means that people are driving a lot more, using gas, and polluting the air. Why we should care is because we are more and more isolated, less active and more crunched for time. Our local economy is suffering while an enormous portion of our paychecks goes to pay for cars, gas, repairs, insurance and finance charges. This should matter: social life is hampered by lack of connections, our bodies are falling apart from lack of use, and we lack the time for meaningful civic engagement. Oh, and don’t forget a solid job, place to live and reliable transportation to hold it all together. These are all factors of happiness: friends, good health, a sense of belonging – and financial security.
I’m going to suggest that the TOD model provides the remedy for these shortcomings. It meets an unmet need, appeals to a large demographic group, creates affordability, stimulates local business, requires less gasoline, and generates less air pollution.
Here’s a thought experiment, and it requires a little indulgence in the theory of averages. On the other hand, this experiment is designed to address some of what’s lost when we average out life as we know it in the region. The entire growth of Phoenix, Tempe and Mesa between 2000 and 2010 was just under 190,000 people. Those were boom times, but the 3 connected Cities grew sustainably. If we imagine another 190,000 people in the 3 cities in the next 10 years, how would it look if they all moved into the central cities near train stops? Would we have to tear down low-rise buildings, fill in open space and pack the area with high-rise buildings? Would sidewalks be crowded, traffic clogged and parking a nightmare?
The answer is not very dramatic. The numbers point to simply filling in most vacant parcels with 2-3 story buildings, and a few taller buildings in the 4-6 story range. The existing fabric can stay, and not much infrastructure is needed. True, some buildings may need to be moved, or demolished. Some roads will need repair and sidewalks will need to be built in places. In general, however, things can be fixed up, saved and brought back to life. Is this boring work? Maybe. A glam condo tower is more prestigious than fixing what you got. But this is how the great urban neighborhoods are made. There are examples all over the US.
Here’s how the numbers work: There are 32 light rail stations that will be in existence in the next 10 years. (28 current and 4 new ones in Mesa) the preferred areas for housing are centralized and within a 5-10 minute walking radius around the stations. That creates two circular zones, a ½ radius circle with a ¼ mile radius circle in the middle. This area is called a “station area”. The total area is about 500 acres, with 125 acres in the inner circle. The inner circle is the preferred investment area because those properties and infrastructure resources are most valuable to creating a truly walkable neighborhood. The ½ mile radius is very similar, with lower intensity. As you move away from the station, the intensity drops off, and more than ½ mile, the walking commutes have proven too long to support local walk-to destinations. Bicycles, bus connections, circulators – all are important factors in expanding the mobility platform, but from a growth perspective, the rail stations create the center point. It is by far the preferred form of transit.
OK, so 32 stations x 500 acres is a total of 16,000 acres. If the development for 190,000 new inhabitants were to take place on currently vacant land (+/- 20% of the total), it would need to be built at an average density of about 29 units/acre. This is about the density of a 2 story apartment building. With a mix of two story townhomes, some 2-3 story apartments, and a few mixed use buildings of 4-6 stories, this average density can be achieved.
Housing density also, statistically at least, predicts vehicle miles travelled per person (VMT). Lower housing densities of 2-4 units per acre with few walk-to destinations and little transit service require between 10,000-12,000 VMT/year/capita. Compare this with the 5000-6000 VMTs for the station areas described above. Add in 190,000 new residents, and total gasoline saved over the next 10 years could be 400-600 million gallons. You can do your own math to see what this would cost. With gas prices increasing each year, it adds up to a lot of money.
Building even at these modest densities on currently vacant land, saving billions on fuel, leaving cleaner air, getting more exercise and having more fun…what’s not to like? Of course, the story is really not this simple. There is a home building industry in motion, and there are thousands of homes and lots ready to go in other locations. Vacant land is not always zoned for residential, and property owners may want to hold out and speculate on rising land values. Banks and other institutions own land and may not be motivated to sell or develop. It is slightly more expensive to build TOD, and the 3 cities have only a few examples of successful local projects. Many neighbors oppose these developments and cause delays for developers and city officials. It’s not the norm (yet). These obstacles would have to be overcome to implement such a plan.
This math exercise is not much more than a back-of-the–envelop calculation. Yet it illustrates how un-scary and easy it could be to redirect growth in the 3 Cities of the Valley that have already chosen to alter their destinies and pursue a more sustainable future. What precious little agricultural and natural Sonoran desert that is left in these cities will become more of the same: subdivisions, strip centers and commercial areas. The future of these cities now lies at their hearts, and the future of their communities requires completion of plans left undone for decades. For everyone in the Valley, this is our unfinished business.
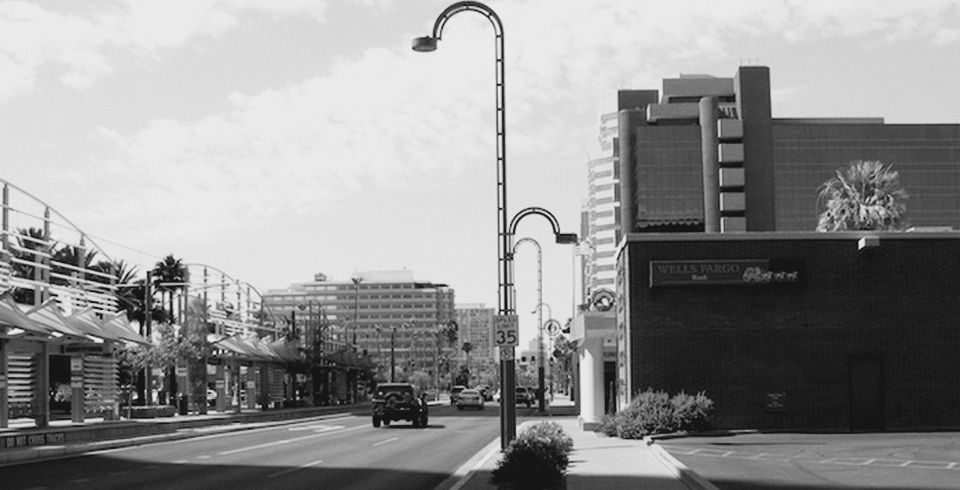
Photo Credit: The Camelback/Central Light Rail stop in Phoenix. Photo by Taz Loomans.


Nice article. 🙂
Being realistic though, I doubt we see much residential built between the 12th St stop and the Priest stop. Maybe some HUD housing and some affordable housing near the 12th St stop serving downtown, but most of that middle area near the airport is still a long way from being appealing.
Your point still stands though, one only need to look at a Google Satellite view map of CenPho to see miles of surface lots and dirt lots that could easily be infilled.
Hopefully our next Mayor will be wise enough to get all the CenPho land bankers in a room and work out what its going to take for them to ever be incentivized to actually develop their lots.
The need for a 50% adjustment to the density calculation aside:
How do we make sure that this dense infill development happens in lieu of more economically unsustainable sprawl?