


Today’s post is by guest writer Matthew Salenger and is a data excerpt from a research project that his firm colab studio recently undertook about where people live and how connected they are with where they live. Matthew co-founded colab studio, llc in 1999, which has won over 25 major design awards for residential and commercial architecture, as well as public art. Matthew is currently a visiting faculty member at ASU, teaching a graduate design studio, and also teaches a sustainability philosophy class for a local educational group called “Ikoloji” (pronounced “ecology”). He has also been a part of several exhibitions and installations, and has presented the work of colab at many prestigious universities and organizations nationally.
The following data excerpt involves research organized around attempting to understand how people directly control their surrounding urban environments through personal everyday decisions such as where to dine, shop, live, and be entertained. Our team collected over 100 lengthy interviews in person from people all over the Metropolitan Phoenix area. The data shows a stark difference of the way people live depending on their location in the city, and does point to a correlation between lifestyle choices and surrounding environment. However the most interesting aspect we uncovered is the lack of connection some people have to the city as a place- environmentally, socially, and culturally- when they live in the gigantic “middle” zones far from central areas and the exterior fringe.
Research Basics
This project is based on a collaboration between colab studio (Matthew Salenger, Karl Eicher, and Maria Salenger), members of the ASU School of Art and Pyracantha Press (Dan Mayer, Prof. John Risseeuw, Prof. Mark Klett and Patrick Vincent), as well as research assistance from 13 ASU students hired through a prize granted by the ASU Phoenix Urban Research Laboratory (John Armendariz, Raymond Banker, Amie Dabu, Alexandra Fuentes, Kylie Huffman, Camarie Kroeger, Heather Liddle, Alison Magley, Molly Morgan, Sarah Rowland, Sharee Tavilla, Harold Thomas, Kristi Utter, and incalculably important guidance from our research guru, PhD student Angela Hines).
The research covered all of Metropolitan Phoenix including participants from Buckeye, Wittman, Anthem, Apache Junction, Gilbert, Laveen, and everywhere in between. We broke the city into three different zones as follows:
Zone 1 (Z1): Downtown cores of Phoenix, Glendale, Scottsdale, Mesa, and Tempe, as well as the areas between these cores. We considered these areas to be centrally located and associated, or close to, areas containing higher densities of housing, commercial centers, cultural, and professional sport facilities.
Zone 2 (Z2): Everything outside of zone 1, and within the 101 and 202 loop freeways. We considered these areas to be outside of core urban areas, but not at the outskirts of the city.
Zone 3 (Z3): Everything outside of Zone 1 and Zone 2 including “leapfrog” developments such as Anthem, Wittman, Queen Creek, and Laveen, which operate as “bedroom communities” for the metro area. These areas are all currently within, what we call, the “outskirts” of town.
Research is cited via percentages of participants organized by the three zones (ex: Z1=50% indicates 50% of the participants in zone 1 provided a particular answer.) The Phoenix Metropolitan area is abbreviated as PHX.
Assertion Excerpt:
Our findings show how little connection to the city those living in Z2 have in comparison with those living in the other two zones. As we demonstrate, Z3 people living on the outskirts of town appear to have a close connection to the desert environment around Phoenix, and Z1 people living downtown are connected to a wide variety of social and cultural networks. Where people choose to spend their time and money is quite telling about what they enjoy doing and how connected they are to the community of PHX, which is what our research is centered on. As we will show, people in Z2 generally do not have connections to PHX as a place including landscape or social/cultural communities within town, compared to the central and outskirt regions.
For instance, when asked what aspects led to participant’s decision on where to buy or rent their home, we found people in Z2 were half as likely to answer that “location” was a determining factor as people close to downtown areas (Z1=71%, Z2=35%, Z3=62%). To these people, it wasn’t important where they lived, or what was around them, but rather just that the home fit their needs. Also interestingly, people in Z2 were most likely to be content about where they are living at a whopping 91% (Z1=79%, Z2=91%, Z3=76%), but also most likely to move away (Z1=50%, Z2=73%, Z3=19%). What this shows is Z2 residents are uncommitted to a particular place or community, and are content to stay that way. Because respondents in Z2 have less connection to some aspect of PHX, and are less involved with the community, their answers suggest they are less likely interested in improving the city environment.
Z2 people also tend to prefer stores and restaurants that are national chains over locally owned businesses. When we asked participants to tell us where they shopped for food, clothes and necessities, the highest percentage of chain owned stores occurred in answers from Z2 people at 97% (Z1=88%, Z2=97%, Z3=76%). Conversely, the lowest amount of non-chain locations occurred in the answers of zone 2 participants as well, at 17% (Z1=23%, Z2=17%, Z3=24%). To demonstrate this pervasiveness, one Z2 interview took place at a Starbucks within a Borders Book Store within Keirland Commons Mall, itself owned by a large national chain of malls.
Similarly, Z2 participants are 50% more likely to dine at a chain restaurant than people living in downtown areas (Z1=38%, Z2=60%, Z3=81%). The very high rate of participants in Z3 visiting chain establishments is due to the lack of locally owned establishments on the outskirts. New residential developments have to rely on quick moving, big money, chain-owned businesses that are a “known quantity” to fill out brand-new malls. The proximity to standard, and familiar, dining establishments along with the farther distances to locally owned restaurants, makes it difficult for Z3 residents to support anything but national franchises. However, Z2 residents often have a convenient locally owned option, and still seem to gravitate towards chains rather than visit local eateries.
In addition to the lack of shopping at locally owned businesses, Z2 residents appear far less likely to visit local cultural organizations, such as museums, performance venues, libraries, and community events. They are even less likely to visit such venues than those living in Z3 (Z1=27%, Z2=14%, Z3=24%), which shows people in Z3 support cultural institutions of PHX more than those in Z2, and show this commitment by driving an hour each way to be a part of it.
This ensemble of people within the large band between Z1 and Z3, with lower levels of connection to the community and culture of PHX, also hold a slightly worse opinion about the future of the city. When asked whether Metropolitan Phoenix is improving or declining, Z2 participants were less likely to say improving (Z1=67%, Z2=57%, Z3=62%) and more likely to say “declining” (Z1=27%, Z2=34%, Z3=24%).
What the data and direct answers from the interviews show is most people in the middle zone have a greater disconnection with the people and location of PHX, a less favorable outlook of PHX, and are far more likely to move away than the other two zones. In conjunction with this observation, a recent study, published in the Journal of Personality and Social Psychology (Vol 102(1) Jan 2012 pp149-162) suggests “residential mobility breeds familiarity-seeking” in people. The Journal study shows more mobile people prefer to live in cities and areas containing national chains they are acquainted with out of a desire to balance the unknown appearance of their new town with familiar stores that were present where they are moving from. Our data and this recent study would suggest that mobile people tend to move in and out of locations in cities that are less connected to a sense of place, indicating that large areas of sprawl between the culturally-accented downtowns and the landscape-aware outskirts have population portions more likely to be disconnected from the social cohesion of the communities in which they live.
Of the three zones we discuss in our research, Z2 is the largest and therefore most populated. While there is undoubtedly a huge variety of people with a great deal of diversity, there is a clear trend showing a greater degree of disconnection with what makes PHX unique and less support of local businesses and culture. Thus, it would indicate the areas of the city in which to make the most positive impact with increasing community involvement is within Z2. Perhaps another set of research could study how best to guide these mobile people towards greater participation with PHX.
Our Individualocracy study was originally meant to show how our decisions affect everything around us, including our economy, culture, politics, and aesthetics. The findings of our research are meant to demonstrate this by illustrating how connected our choices are to our surroundings. If we want to have an environment around us filled with character, local economic vitality, visual and cultural interest, and sustainability, we need to shop, dine, communicate, and (most importantly) make decisions that make this happen. While we understand everyone’s lives have complications that limit their time and abilities to work towards creating a better environment, we hope this study and project can help to raise awareness so we can all make the most thoughtful decisions possible.
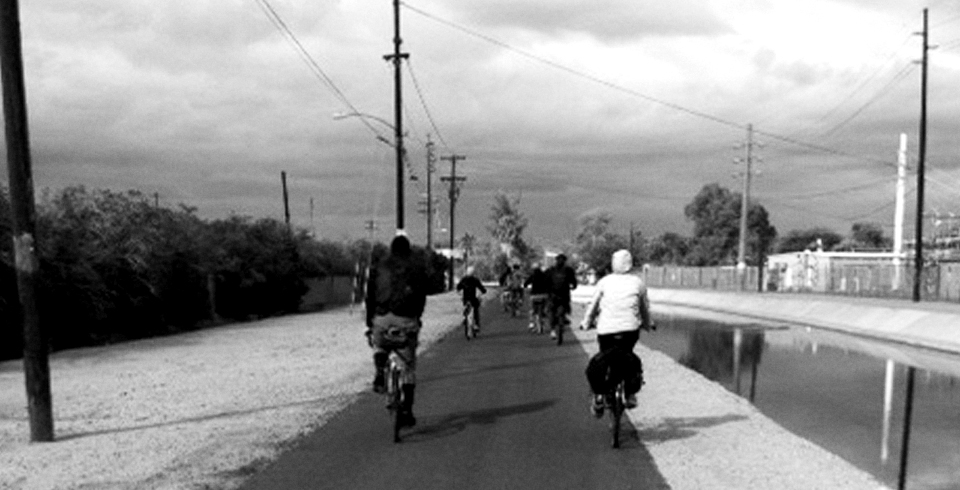
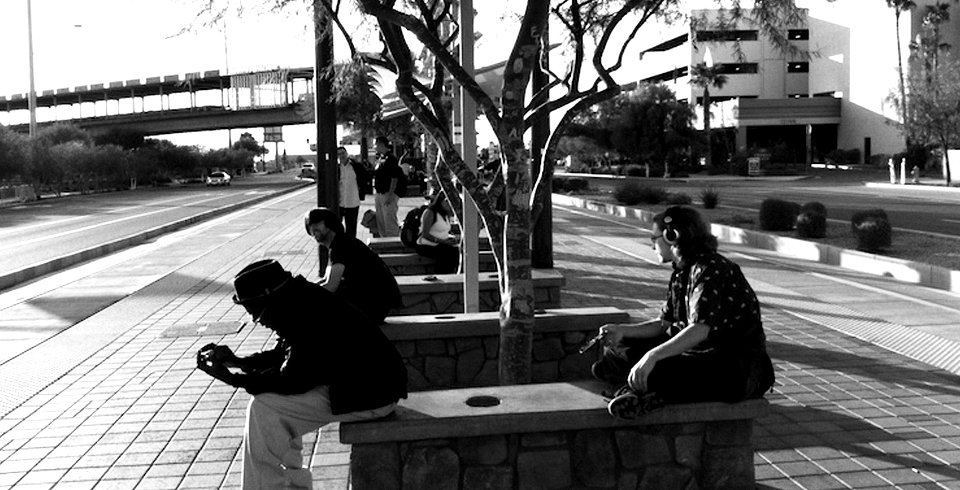
Image credit: Image courtesy of the author.


There are many challenges hindering sociability and community involvement in zone 2. Just the other day a friend suggested I visit my local coffee shop to meet people. Besides Starbucks and Dunkin Donuts, I couldn’t think of one. Not only do there seem to be few locally owned coffee shops and eateries, but the retail environment doesn’t encourage lingering and sociability either. Except for the “make-believe” ones like Kierland and Desert Ridge we have only generic strip malls spaced every few blocks but not close enough to walk to. There are very few “cultural” venues in the burbs so people have to travel into town for that experience. Battling traffic and the heat is often the greatest deterrent there.
I’m not making excuses for the apparent disinterest zone 2 residents seem to have for their fine city, I’m just sharing my observations as someone trying to break the mold.
How many people interviewed made up each of the zones? And how did you pick your subjects to interview?